- Presenting the recently released Log Viewer for Laravel. Open source, incredibly feature-rich, quick, and elegant. What else are you need of ?
- Finding what you’re looking for will no longer require you to read the raw Laravel log files (as well as other log kinds).
- You can search, filter, and quickly understand your Laravel logs with Log Viewer, which also makes it easy to inspect individual log entries. It is simple to install and free.
Features: –
- Examine other log kinds, including those from Horizon, Apache, Nginx
Redis, Supervisor, Postgres, and more - Look through the logs
- Sort by log level (debug, info, error, etc.)
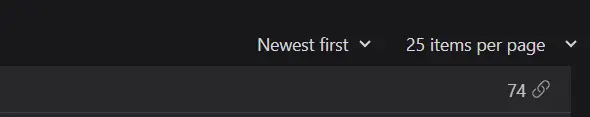
- Shareable links to specific log entries
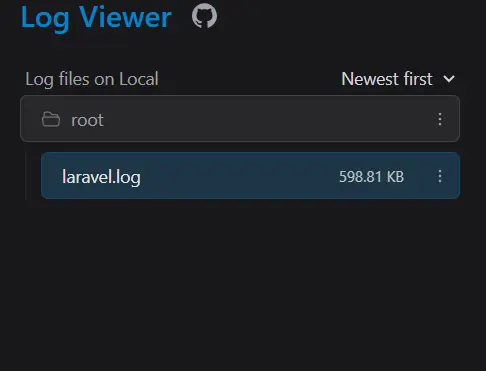
- Dark mode
- Mobile-friendly user interface
- Multiple host support
- Keyboard accessibility
- Log files can be downloaded and deleted via the user interface
- Support for Horizon logs (up to Horizon v9.20)
- File, folder, and log entry API access
- Emails sent to the logs with previews
Usage:-
To install the package via composer, Run:
• composer require opcodesio/log-viewerAfter installing the package, publish the front-end assets by running:
• php artisan log-viewer:publish Once the installation is complete, you will be able to access Log Viewer
directly in your browser.
- (for example: https:// project-location /log-viewer)
Important Features : –
- Adaptable Views
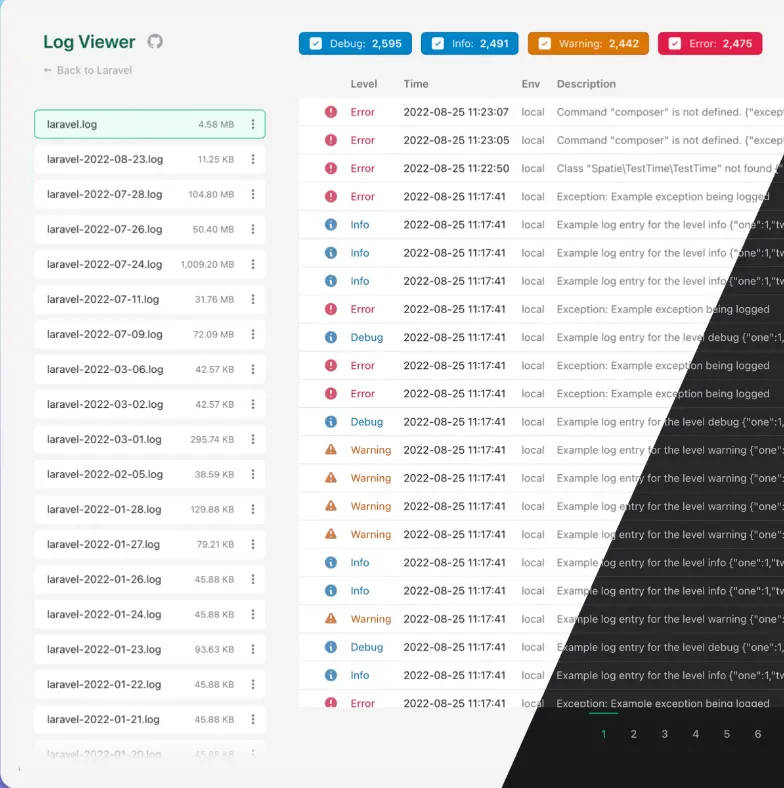
This Log Viewer’s highly customisable UI is one of its best qualities. The
displays can be customized to show the log data that is most pertinent to your project. Various log levels, including info, error, warning, and more, are supported by the viewer and are color coded for convenience.
- Pagination & Sorting: By default, logs are paginated, making it simple to browse through big log files. Sorting by log level or date makes it easier to identify problems fast.

- You can easily isolate particular events or error messages by using the search feature, which allows you to filter log entries by keywords.
- More Complex Filtering
Out of the box, this program offers sophisticated filtering features. Date ranges, log levels, or even custom tags that you define in your application can be used to filter logs.
More Complex Use Cases: –
Slack integration: The Log Viewer can be integrated with Slack or other notification channels for apps that need real-time notifications. Using this viewer in conjunction with Laravel’s logging capabilities, you may create real-time warnings for important problems so that your team can act promptly.
Please visit the Log Viewer Documentation to Learn about
configuring Log Viewer to your needs.